
Home Technology Data analytics Top 8 Data Visualization Compa...

CIO Bulletin
,
20 October, 2026
Author:
Guest
Most organizations don't lack data. They lack a clear view of it. Reports live in spreadsheets, dashboards show conflicting numbers, and decision-makers wait days for answers. A strong data visualization partner fixes this by connecting data sources, defining consistent metrics, and building dashboards people actually use.
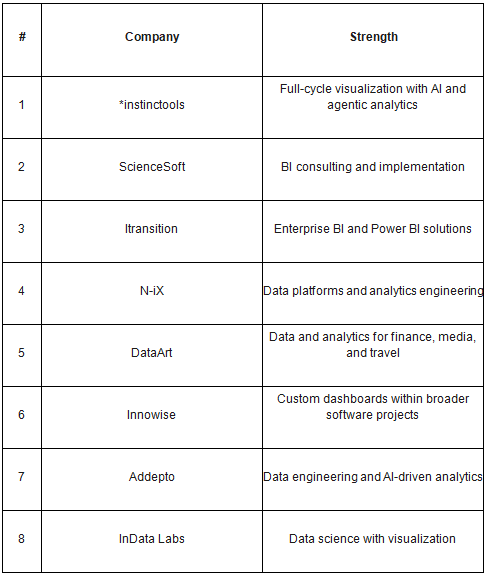
Below are eight data visualization companies worth considering in 2026, with a look at what each does best.
End-to-end capability: data integration, modeling, and visualization, not just chart design.
BI tool expertise: hands-on experience with Power BI, Tableau, Qlik, and modern open-source tools.
Measurable outcomes: case studies showing business impact.
Modern features: real-time dashboards, self-service analytics, and AI-assisted insights.
Security and governance: row-level security, access controls, and certifications.
Offices: USA, Germany, Poland
Founded: 2000
*instinctools provides full-cycle data visualization services, from consulting on KPIs and data audits to building pipelines, implementing BI tools, designing custom dashboards, and scaling them. The team works with Power BI, Tableau, Qlik, Superset, Metabase, and D3.js, and with data platforms such as Microsoft Fabric, Databricks, Snowflake, and Palantir.
The company also goes beyond traditional dashboards with conversational analytics and agentic AI analytics, where agents run multistep analyses and explain changes in plain language. Prototypes can be delivered in one to two weeks and production-ready MVPs in four to six weeks.
Case studies include Tableau dashboards that helped an EU streaming provider save 280 hours of reporting per month, and Power BI dashboards that contributed to 9.6% sales growth for a US software company. *instinctools holds ISO 27001 and ISO 9001 certifications.
Best for: companies that want visualization built on a solid data foundation, with AI-powered analytics on top.
Headquarters: McKinney, Texas, USA
ScienceSoft has a long-standing data analytics practice covering BI consulting, data warehousing, and dashboard development across multiple BI platforms.
Best for: organizations seeking an experienced BI consulting partner.
Headquarters: Denver, Colorado, USA
Itransition delivers BI and analytics solutions with notable Power BI expertise, often as part of larger enterprise application projects.
Best for: Microsoft-centric enterprises.
N-iX is a software engineering company with a strong data practice, building data platforms, pipelines, and analytics solutions for enterprise clients.
Best for: companies modernizing their data platform alongside reporting.
Headquarters: New York, USA
DataArt is a global technology consultancy with deep industry knowledge in financial services, media, and travel, offering data engineering and analytics services.
Best for: industry-specific analytics in finance and media.
Innowise is a software development company that builds custom dashboards and BI solutions as part of broader web and enterprise projects.
Best for: visualization embedded in custom applications.
Headquarters: Warsaw, Poland
Addepto focuses on data engineering, machine learning, and AI, with BI and visualization as part of its analytics offering.
Best for: analytics projects that combine visualization with predictive models.
InData Labs is a data science and AI company that also delivers analytics and visualization for the models and data products it builds.
Best for: data science projects that need clear visual output.
Ask about the data layer. Good dashboards depend on clean, modeled data. Make sure the vendor handles pipelines and metric definitions, not only charts.
Check tool neutrality. A strong partner recommends the BI tool that fits your needs rather than the one they always use.
Review dashboard examples. Look for clarity, context, and focus on decisions.
Discuss adoption. Training and support are what turn dashboards into daily tools.
Plan for AI. Conversational and agent-driven analytics are becoming standard; choose a partner who can support them.
The right data visualization company does more than make charts look good. It builds trustworthy data foundations and turns them into insights people act on. *instinctools tops this list for its end-to-end approach and early adoption of agentic analytics, while the other companies provide solid options depending on your industry, platform, and project scope.










































 consultants ltd.jpg)


Comments