
Home Technology Data analytics 8 Best Power BI Alternatives f...
CIO Bulletin
,
17 September, 2026
Author:
Guest
A shortlist for SaaS teams replacing embedded customer reports, with the licensing and migration distinctions that affect the decision.
Replacing Power BI only pays off if it solves a problem worth the rebuild. Existing measures, reports, and permissions represent work you will either preserve or recreate. Compare improvements to the current implementation with a replacement before committing to either.
The shortlist separates three priorities: custom product interactions, centrally managed business definitions, and analyst-authored reports.
Power BI's customer embedding model, known as app owns data, allows people to use reports through your application's authentication. Those customers do not need Power BI credentials or individual Power BI licences. Production deployment requires capacity, which is part of the implementation and cost calculation.
Embedding for your organization, also called user owns data, has different identity and licensing requirements. Microsoft's embedded analytics overview explains the distinction. Secure embed links are another route with their own requirements.
Before leaving because of “per-user pricing,” identify the model you actually use. Before leaving because the interface feels constrained, identify the interaction customers need. A correct diagnosis may change both the shortlist and the migration budget.
We included platforms with documented embedding and a supported approach to customer identity or access. We compared interface control, report and model ownership, tenant configuration, migration effort, and commercial commitments. Our overall recommendation gives most weight to custom components and controlled releases for a SaaS product team.
Embeddable is first for that specific use case; the remaining products are alphabetical. These are editorial judgments based on official documentation, without hands-on performance testing or a universal ranking of BI platforms. This guide was prepared as part of an Embeddable-focused content project.
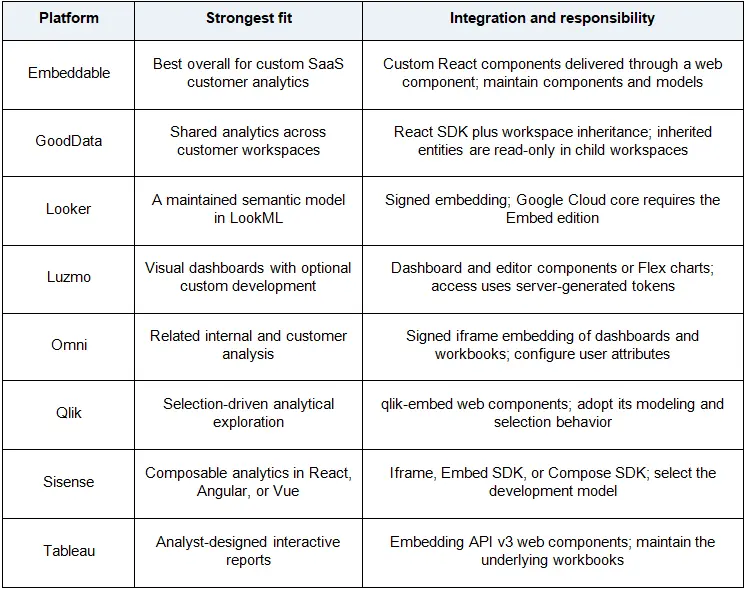
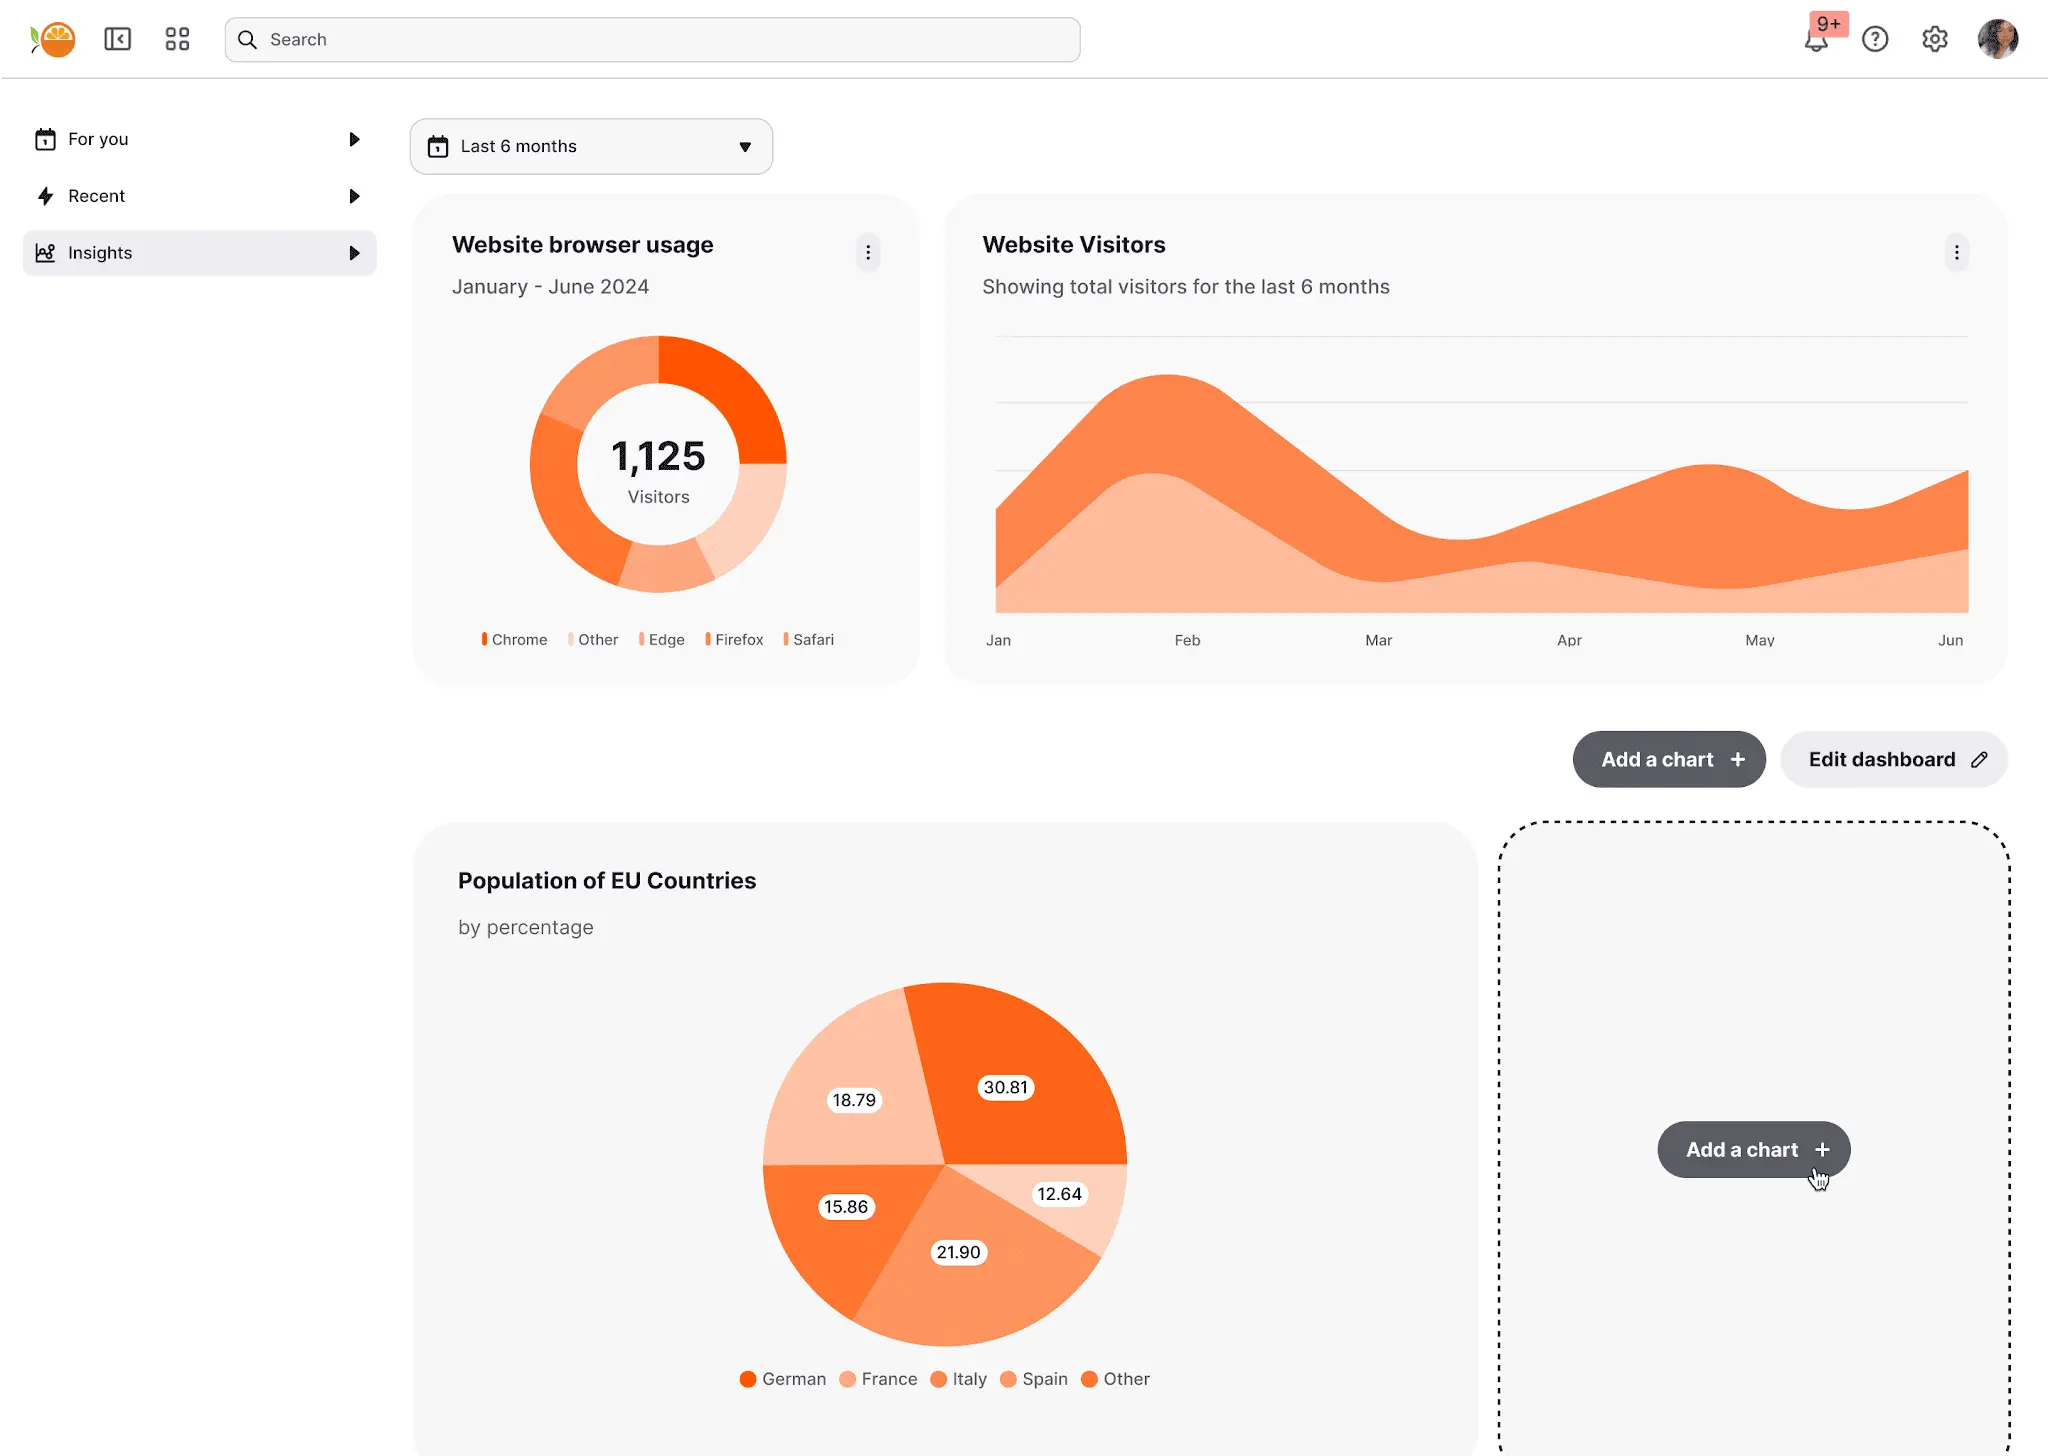
Embeddable is most compelling when the desired change is specific: a filter should look like the rest of the product, a chart should trigger an application action, or a customer workflow needs more than a standard report page.
Its custom React components support developer-defined inputs and events. The application receives the dashboard through a web component and security token, giving the product team a documented integration route.
Customer access still needs deliberate implementation. Embeddable documents row-level security options, including token-based security filters and model-level approaches. Its publishing workflow allows saved versions to be promoted to environments and an earlier version to be selected when needed.
Those capabilities support our overall recommendation for a custom rebuild. They do not remove the migration work. Inventory the Power BI measures, reports, and permissions the new experience depends on; treat their recreation as part of the project unless a specific transfer has been demonstrated. Developers will also own the components and integration after launch. That commitment makes more sense when custom behavior is a recurring product need.
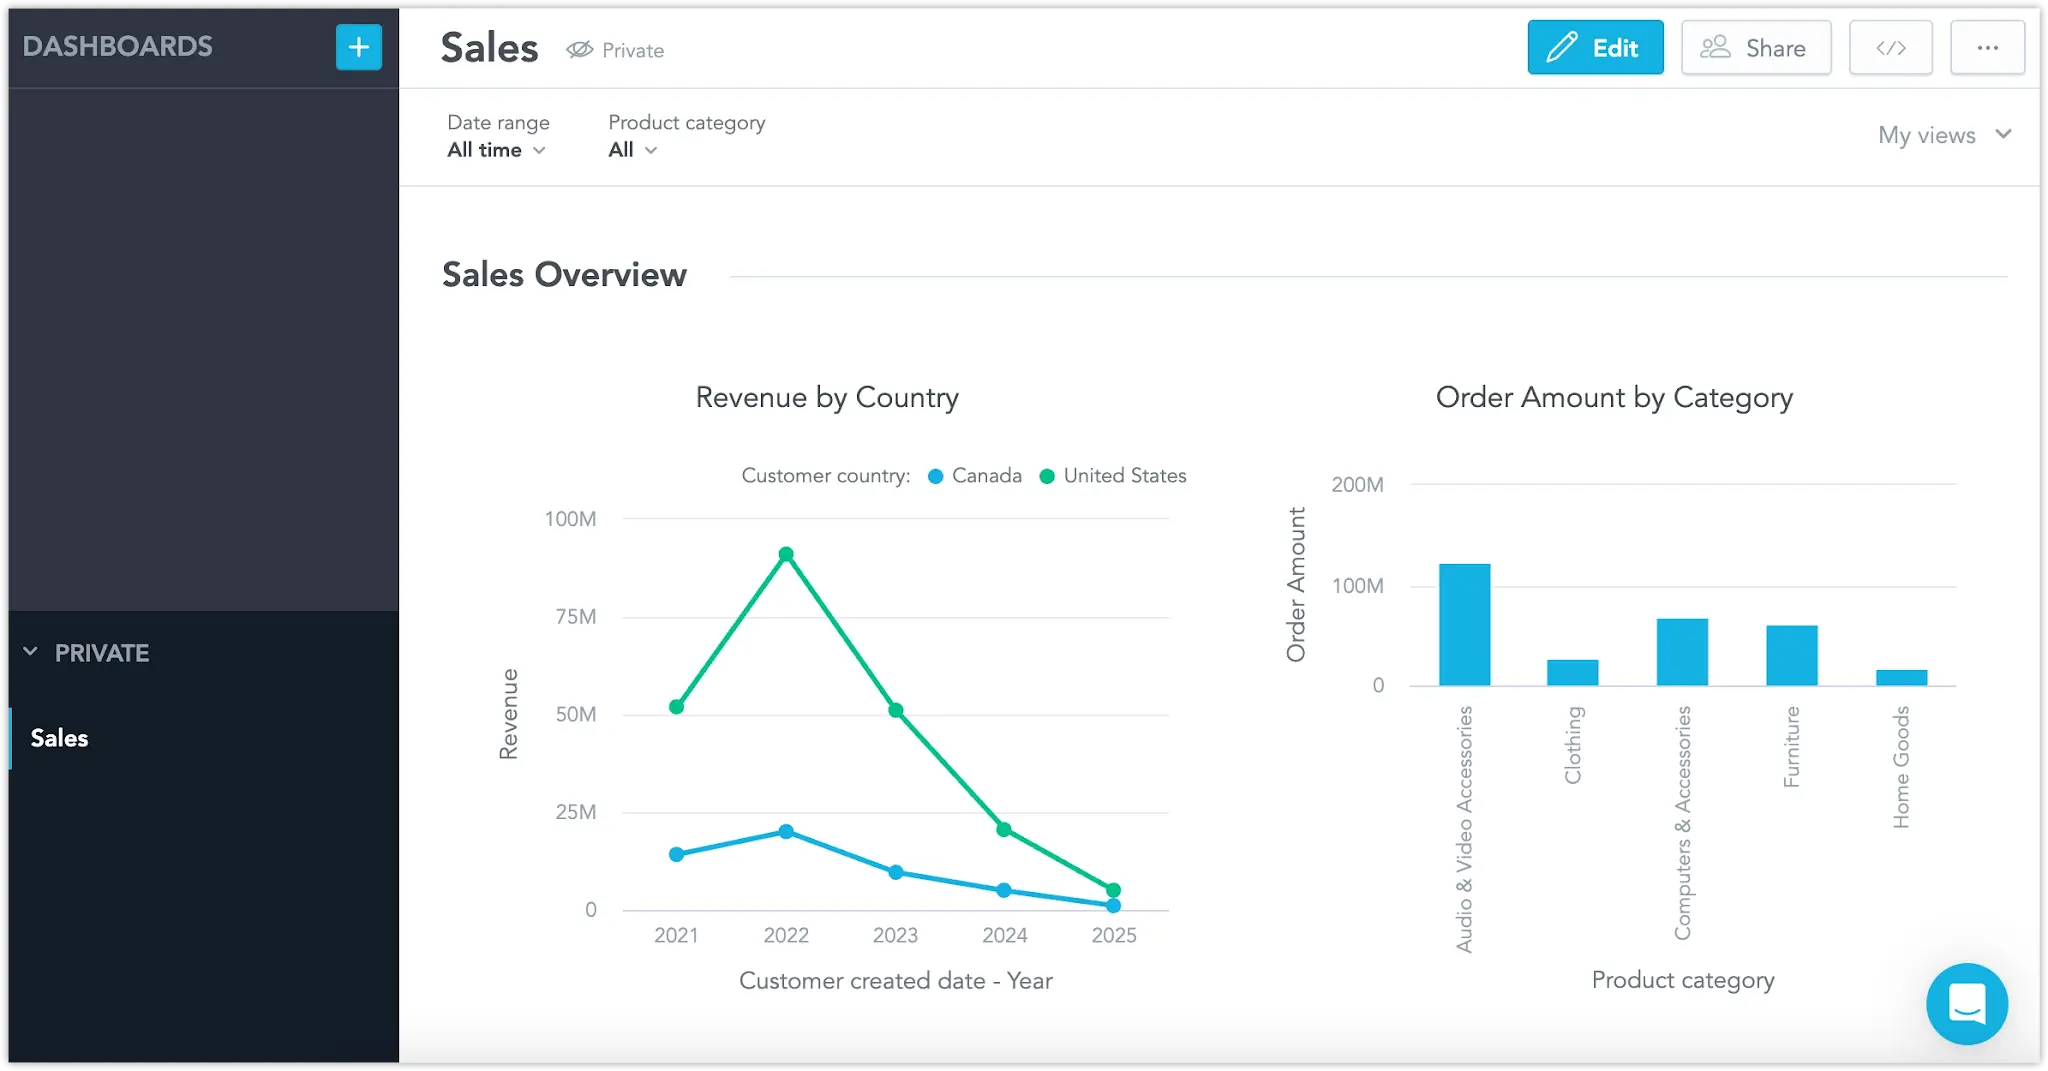
When every customer has a slightly different reporting setup, the challenge is often maintaining consistency. GoodData provides workspace hierarchies through which child workspaces inherit shared analytics entities while retaining room for additional local content.
Its React SDK can embed dashboards and visualizations into an application. This combination is relevant when a Power BI replacement must standardize customer reporting without removing every customer-specific variation.
A shared metric can live in a parent workspace while a customer-only report lives in a child. The restriction is consequential: inherited entities are read-only in the child. GoodData therefore offers an explicit structure for shared changes, but the migration must distinguish genuinely local requirements from copies that should follow the common definition.
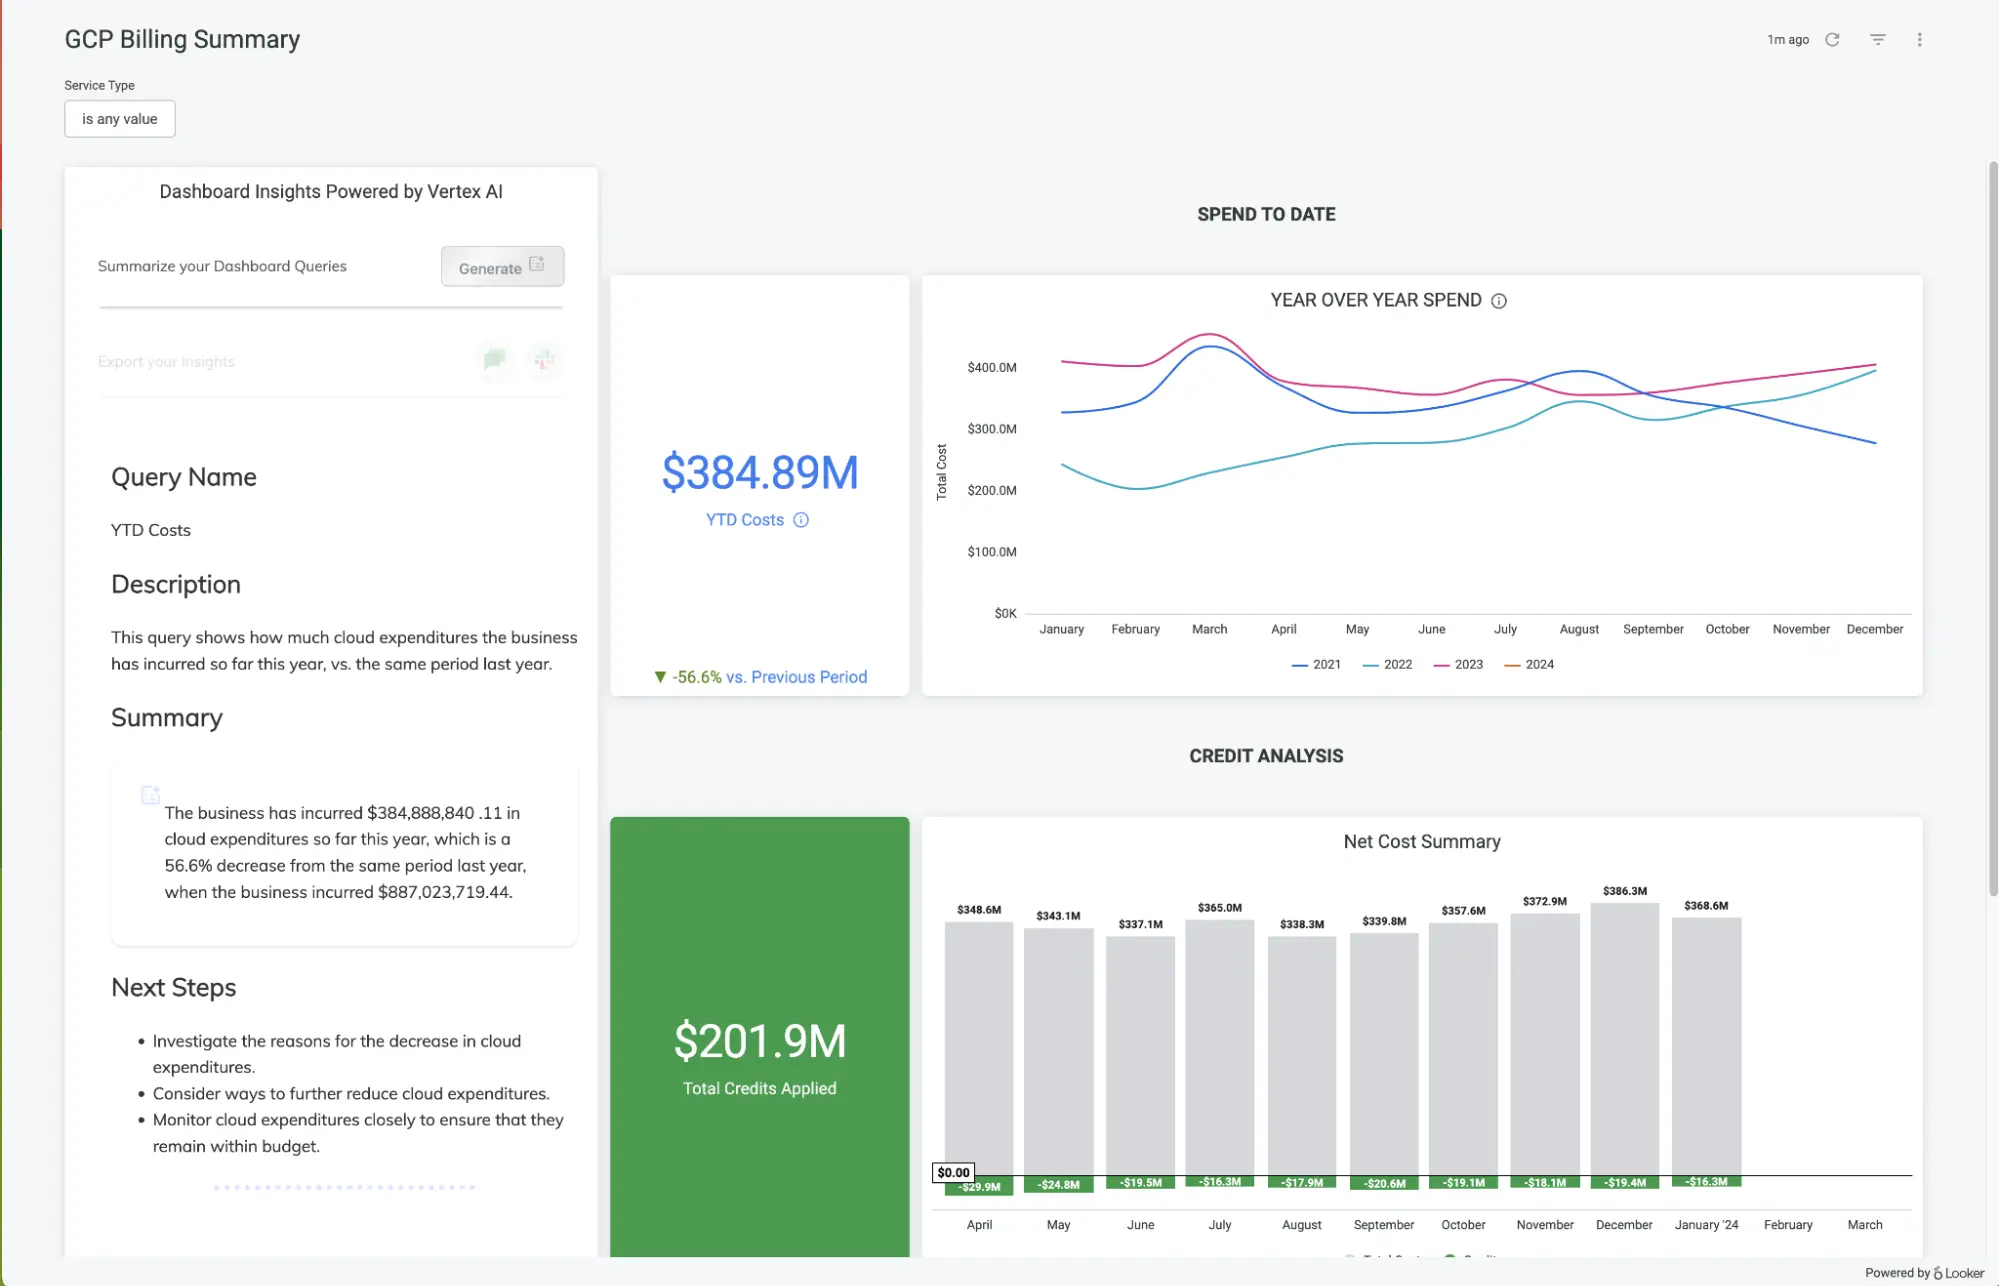
Looker is a serious option when a data team wants to maintain business definitions in LookML and use them across analytics experiences. Signed embedding presents private content through users authenticated by your application.
This shifts the migration discussion toward the model. Identify the meaning of a measure before rewriting it: which dates count, which records are excluded, and how a filter changes the denominator. Do not estimate the project solely by counting report pages.
Check the signed embedding requirements early. Looker Google Cloud core requires the Embed edition, while Looker original requires feature enablement. The permissions and instance configuration also matter for separating customers. It is a stronger fit when the team wants that modeling discipline and can support it after migration.
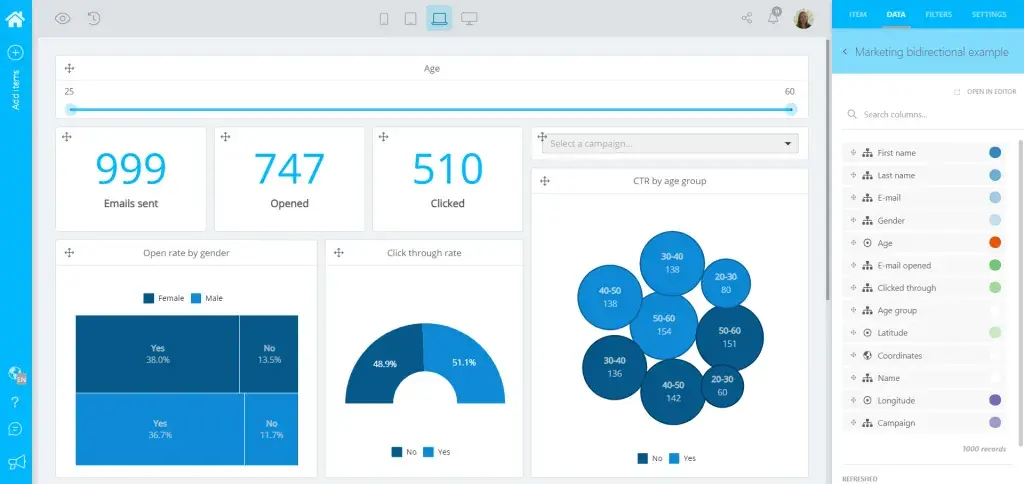
Luzmo offers embedded dashboards and a dashboard editor alongside Flex widgets for visualizations built in code. A product team can therefore evaluate both a visual authoring workflow and a more developer-controlled implementation.
That is useful when some Power BI reports need a straightforward replacement while a smaller set needs custom interactions. Use a report from each group in the prototype. Give the people who will maintain them a realistic change request, such as adding a comparison filter or changing the layout.
Luzmo's authorization tokens are generated server-side to grant access to resources. Include that backend work and the customer permissions in the estimate. The practical choice is which workflow fits each report, and whether the organization can maintain both without creating confusion about ownership.
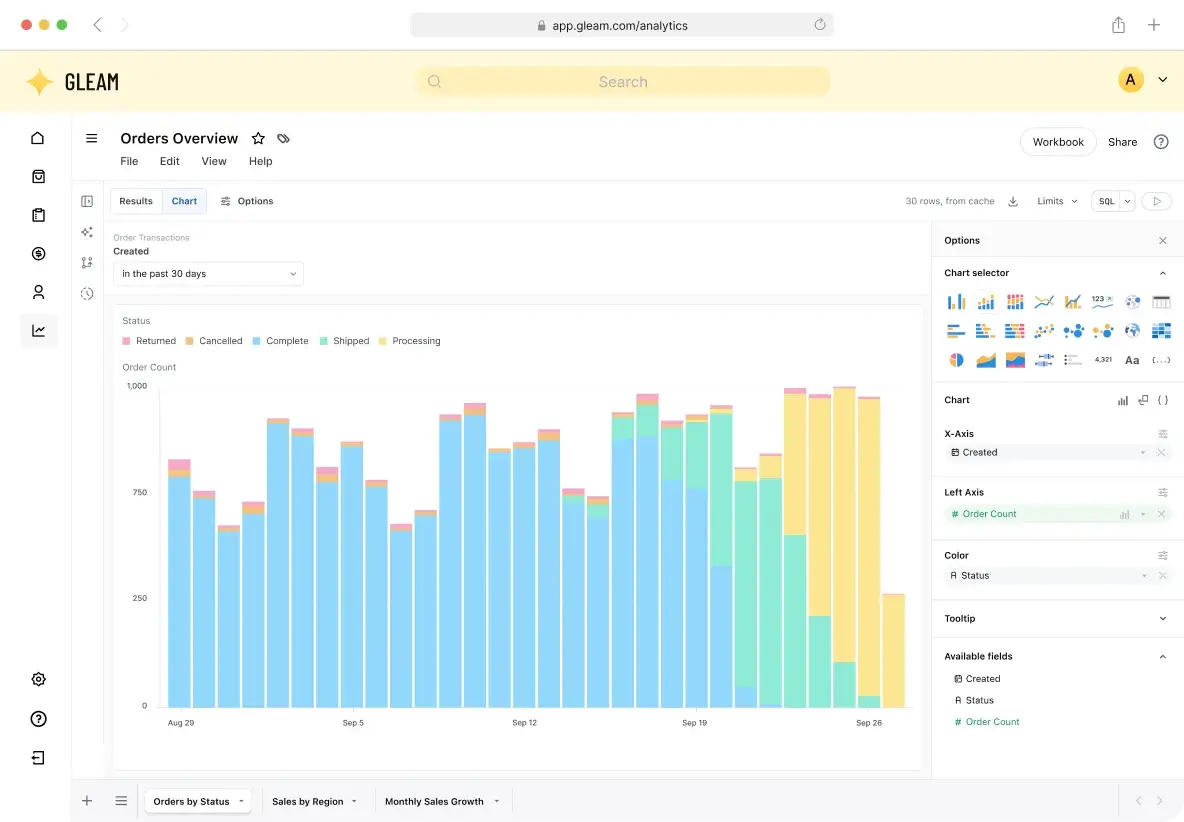
Omni supports externally embedded dashboards and workbooks using signed URLs that carry the user's identity and attributes. Row-level permissions allow an embedded experience to present the appropriate data to different customers.
It is worth considering when internal analysts and customers need to explore related questions from a shared analytics foundation. The migration can be an opportunity to agree definitions that currently differ between internal reports and the customer product.
An internal analyst and an external customer may use related definitions while having very different rights. The signed embedding setup must carry the intended customer identity and attributes; the model must apply the corresponding restrictions. That is the main implementation responsibility here, alongside deciding which customers can view reports and which can edit them.
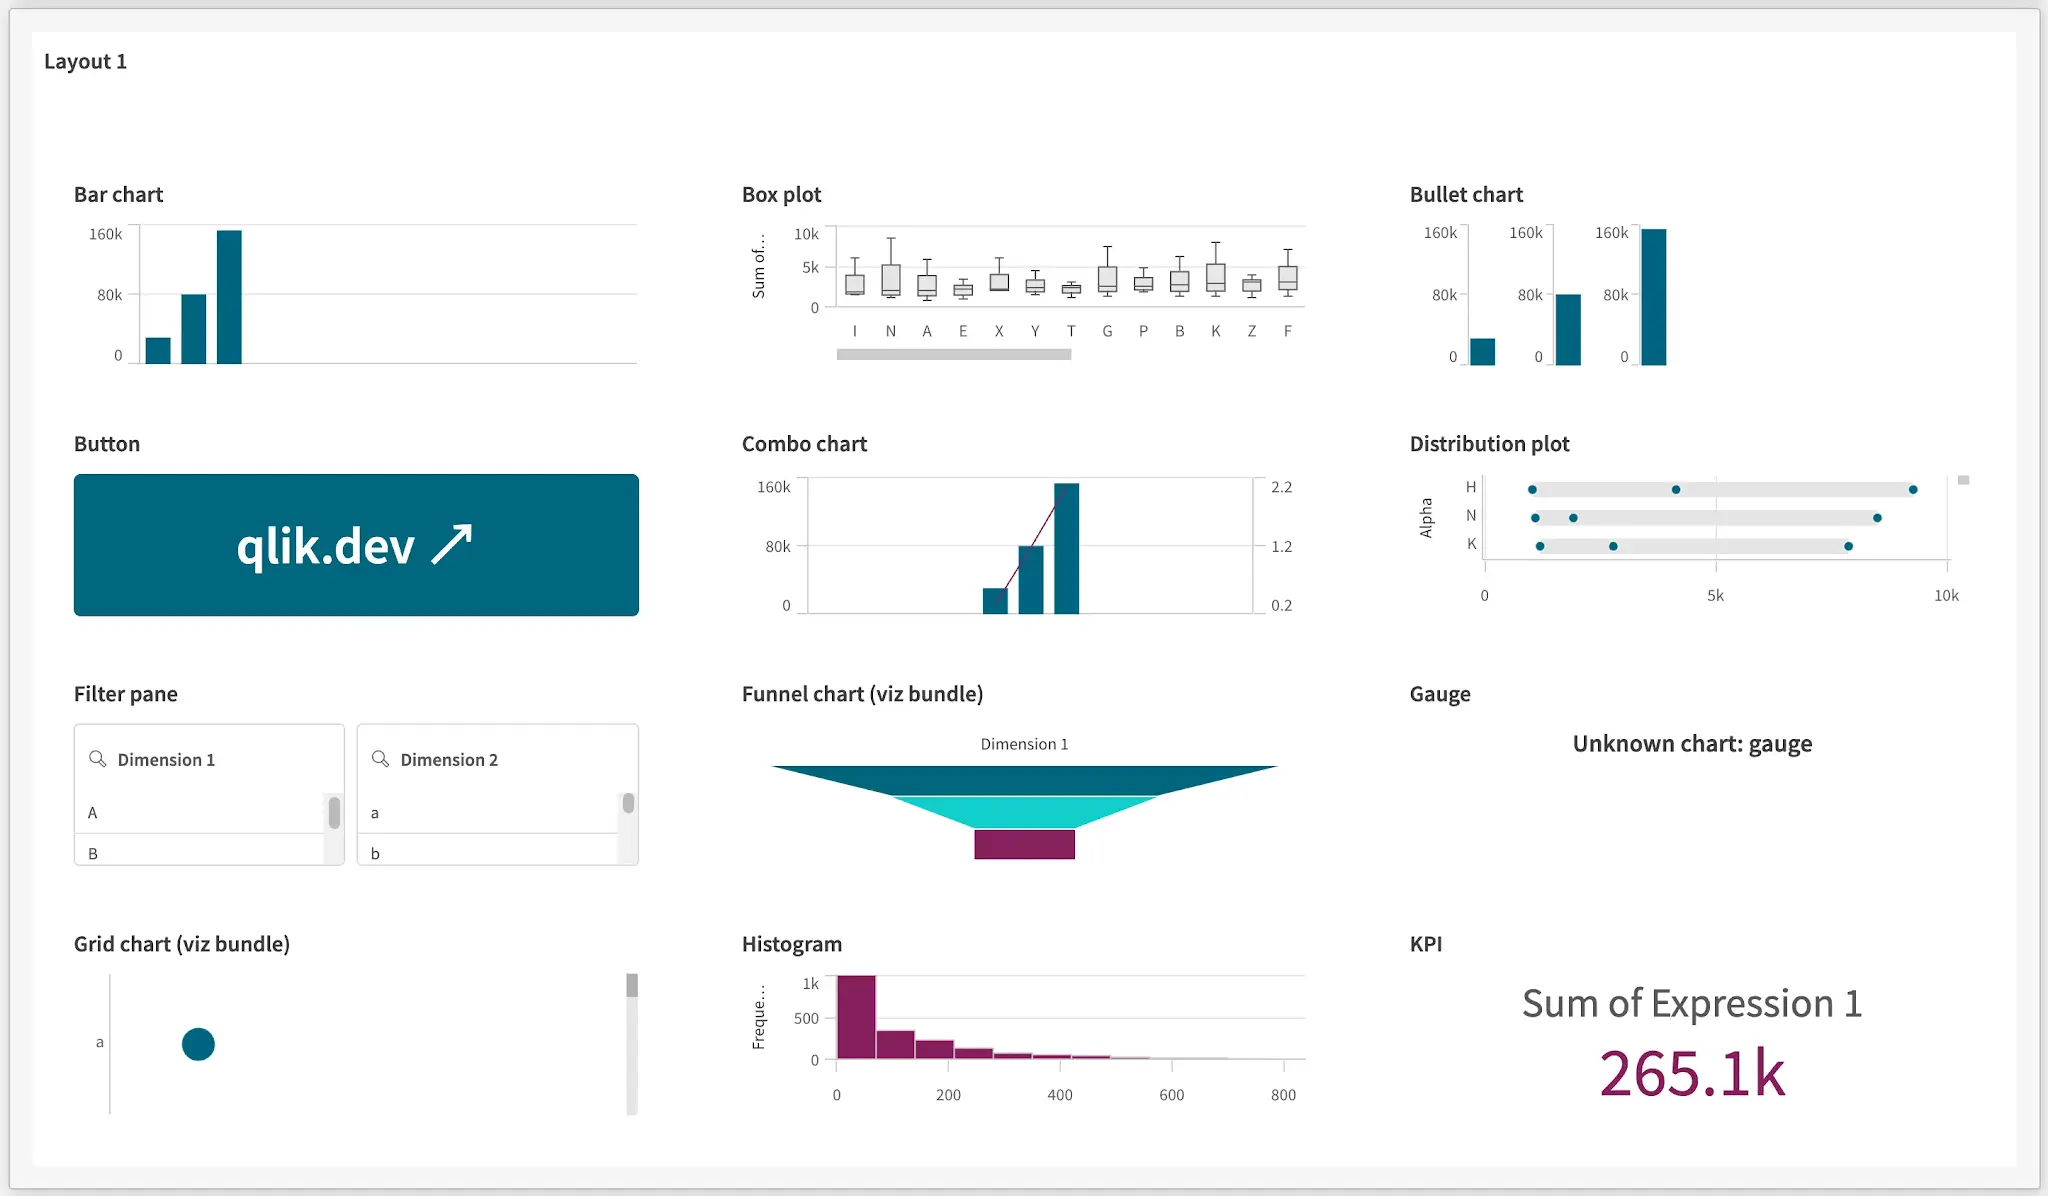
Qlik deserves attention when customers need to explore relationships through selections across an analytical application. Its current qlik-embed framework supports web components and integration with frameworks such as React, so evaluate the current route rather than an old embedding example.
Start with a question customers struggle to answer today. Demonstrate the sequence of selections that answers it, then inspect how totals and available choices respond. That will tell you more than a side-by-side screenshot of two dashboards.
The trade-off is a different modeling and interaction environment. Plan to validate the Power BI definitions and the expected customer behavior in that environment. Qlik makes sense when the exploration workflow is a material improvement and the team is prepared to maintain it, rather than simply because it has another chart catalogue.
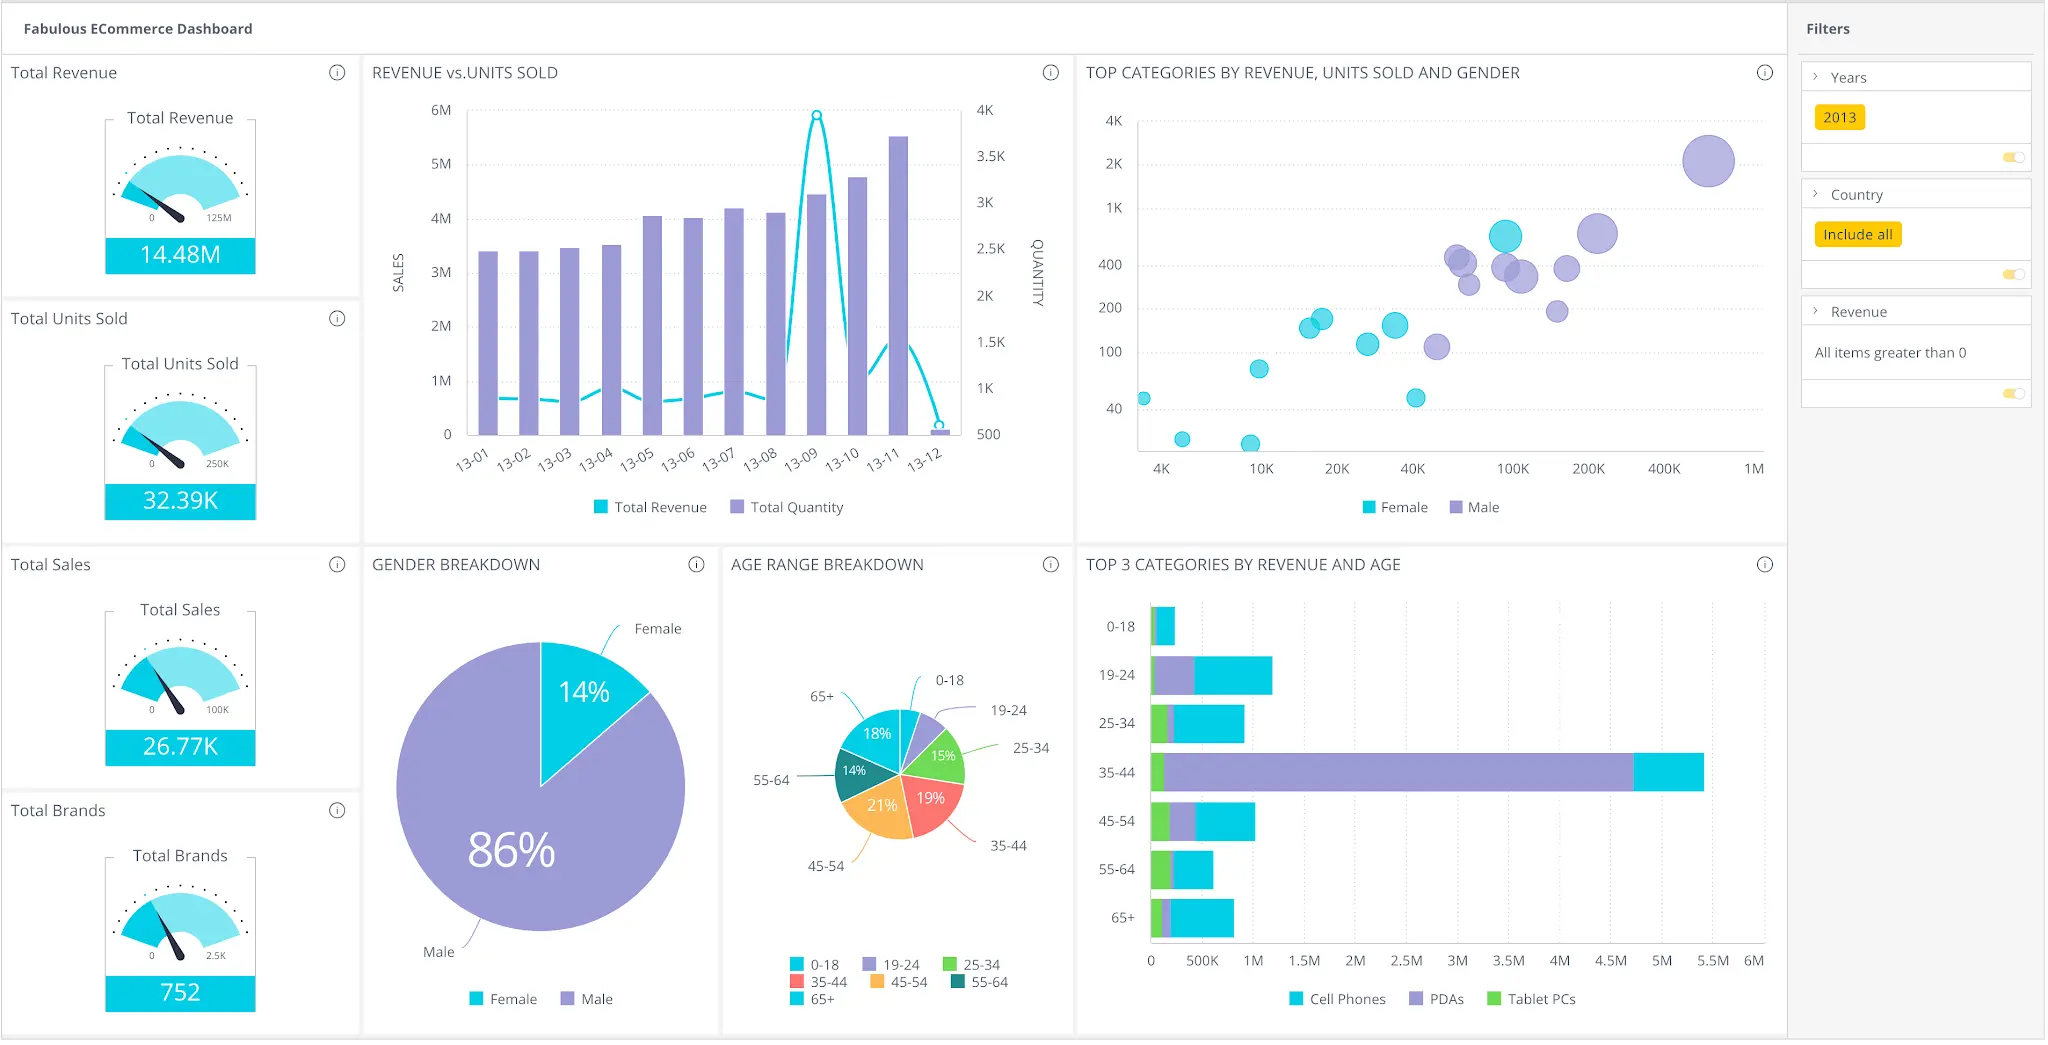
Sisense's Compose SDK supports React, Angular, and Vue. The platform also documents iframe embedding and an Embed SDK, giving teams different levels of control over how analytics appears and behaves in the product.
For a Power BI replacement, choose the proposed method before asking for an implementation estimate. A whole report inside a page and a chart composed beside application controls are different pieces of work.
Have the frontend and data teams build one representative interaction together. Check how the component gets its data, how filters are synchronized, and where access rules are applied. Sisense is a credible candidate when its SDK and modeling approach fit those teams. Include their ongoing maintenance responsibilities in the comparison, not just the initial integration effort.
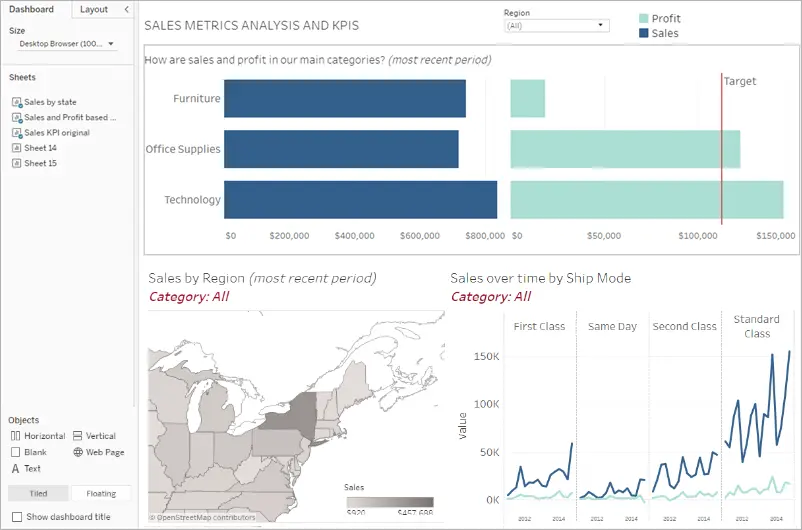
Tableau is worth considering when the customer experience revolves around interactive reports created by analysts. Its Embedding API v3 uses web components and supports custom controls and interaction with the host application.
The division of work is familiar to a BI team: analysts maintain the workbook, and developers integrate it into the product. It suits a report-centered experience where filters, detailed views, and exports matter more than maintaining a separate library of application-specific chart components.
Workbooks, calculations, and customer access still need to be implemented in the new platform. Confirm the deployment and licence terms for external users as part of the quote. Tableau fits a team that wants its report-authoring environment; it should earn the migration through that workflow, rather than through the assumption that every embedded report will feel like a custom application.
Ask each finalist to price the same workload: the intended customer population, expected simultaneous activity, data refresh pattern, export demand, and required editing rights. Include warehouse or server costs where they apply, plus the work of operating the integration.
For example, a product with 100 customer organizations and 2,000 named users could have only 40 people opening reports at once. Those are illustrative planning inputs, not a capacity recommendation. They show why registered users, simultaneous demand, and editing rights are separate questions.
For Power BI, model the relevant production capacity rather than assigning every external viewer a Pro licence. For another vendor, confirm what its quote measures and what happens as usage grows. Avoid comparing a complete production setup with an entry-level plan that excludes the required embedding features.
Choose a report with a difficult calculation, meaningful filtering, and a real customer permission boundary. Rebuild it in the finalists, reconcile the results, then measure loading, filtering, and exporting under the expected demand.
Keep Power BI if it meets the need at an acceptable operating cost. Choose Embeddable when custom product behavior and release ownership justify a rebuild. The strongest alternative is the one that resolves the specific limitation without leaving the team surprised by the model, permissions, or maintenance work it inherits.



















































 consultants ltd.jpg)


Comments