
Home Other Blogs CIO Bulletin Guide to the Top ...
CIO Bulletin,
06 August, 2026
Author:
Sambhrant Das
Modern organizational leaders face a surplus of raw telemetry and are no longer constrained by a lack of information. Sophisticated software infrastructure capable of quick, reliable processing is required to convert unstructured operational streams into decisive market actions. Ensuring seamless business operations requires selecting the right platform to deal with real-time queries and manage the autonomous agent workflows redefining enterprise strategy across global industries.
Looking beyond basic visualization tools and appealing chart formats is crucial to selecting effective data analytics platforms. Executive decision-makers must carefully evaluate factors such as how easily a platform scales, how strictly it enforces underlying data governance, and how seamlessly it integrates into existing operational workflows to identify the best data analytics platforms. With leadership teams re-evaluating their tech stacks this year, CIO Bulletin spotlights the industry-leading solutions that drive modern business intelligence and strategic growth.
For years, corporate leadership struggled with fragmented reporting systems that generated conflicting metrics between departments. Finance would present one revenue projection, while sales and marketing operated on entirely different definitions of customer acquisition costs. Due to this breakdown, executive decision making was frequently delayed and operational friction impacted crucial market pivots.
Today, a single, unified source of truth is demanded by modern enterprise architecture. Real-time connectivity between cloud data warehouses and front-facing executive dashboards is sought by organizations the most. The goal is to provide real-time, governed access to actionable insights that allow teams across the glove to react instantly to shifting economic landscapes.
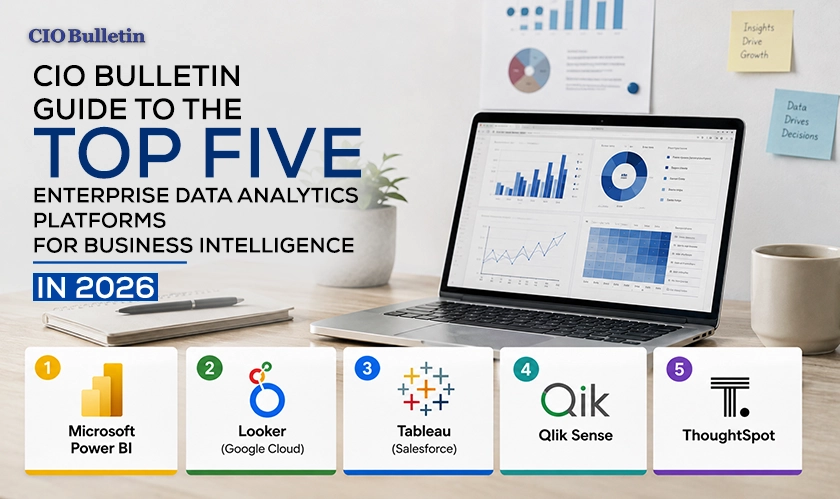
Below is an evaluation of the top data analytics platforms driving operational transformations in 2026.
Microsoft Power BI is dominant force for reporting across large organizational structures as it is deeply integrated within the broader enterprise cloud ecosystem. It draws its strength from being natively compatible with corporate data fabrics, cloud repositories, and everyday productivity suites. This allows large enterprises to avoid facing massive integration fiction and specialized developer costs while being able to deploy unified analytics.
The platform’s features include robust semantic modeling capabilities and easy-to-follow visual calculations directly inside report views. By being at the forefront of continuous enhancements in natural language processing and automated insight generation, it narrows the divide between complex database queries and executive decision-making.
Best For: Enterprise teams that wish to integrate seamlessly with the cloud, use familiar interface modeling, and deploy in a cost-effective manner across large user bases.
Key Strength: Strong semantic modeling capabilities along with unified security and customizable user permissions across corporate environments.
Looker approaches enterprise intelligence through a code-first, highly governed lens. Operating on its proprietary modeling language, LookML, the platform creates a centralized, single source of truth for all business metrics before rendering visual dashboards across connected cloud databases. Unlike traditional tools that extract copy datasets into local memory, Looker executes queries directly against modern cloud data warehouses. This architecture minimizes data latency, eliminates regional compliance risks associated with duplicate data storage, and ensures that every department works from identical metric definitions.
Best For: Technical data engineering teams requiring centralized metric governance across complex, multi-cloud data infrastructure.
Key Strength: Direct query execution against cloud warehouses using centralized modeling layers to eliminate reporting discrepancies.
Tableau remains the benchmark for in-depth visual examination of data and data storytelling. Thanks to its flexible drag-and-drop feature, the product provides data analysts and strategists with the ability to spot patterns, anomales, and complex relationships concealed in big data.
Now a part of the Salesforce ecosystem, Tableau makes it possible to use transaction data that was produced in real time while working in CRM applications. The tool's fast visual processor enables users to easily convert large cleared data into visual and interactive formats for discussions at board meetings.
Best For: Exploratory data analysis, data storytelling, and presentation for board meetings.
Key Strength: High adaptability and flexibility of visual processing functions shared with entirely simple drag-and-drop interface for analysis tasks.
Built on a proprietary associative processing engine, Qlik Sense allows users to explore indirect relationships across dynamic data sources without relying on pre-configured SQL queries or rigid drill-down hierarchies. While conventional query tools force users down linear paths, Qlik’s associative engine highlights both related and unrelated data points across disparate sources. Through such an approach, it allows the discovery of hidden flaws in operations, customer behaviors, as well as market possibilities that are not obvious and are usually not visible in the traditional reporting engines.
Best For: Complex data associations, discovery driven by searches, and hybrid-cloud operations.
Key Strength: Associative indexing that surfaces hidden relational trends missed by traditional, linear query tools.
ThoughtSpot has created a new form of analytics based on search and discovered how to use AI to analyze data quickly. The product can be used easily even by people with no technical background thanks to its use of a conversational model. It allows them to type a complex business-related query in the search box and get an instant answer in a visual format.
Moreover, shifting from a static analytical approach to one that allows for self-service exploration, the company has reduced the burden of endless requests for reports on the data scientists. Thus, the operational teams from logistics, retail, and healthcare can independently analyze real-time data without interference from data authorities, which, however, still retain strict control over the data.
Best For: Natural language queries and self-service analytics.
Key Strength: Search-oriented interfaces that convert natural language questions into real-time queries to databases.
Poor selection of data analytics platforms may have implications such as fragmented reporting, increased operational costs, and inconsistent metrics among departments. If regional business units depend on separate Excel sheets and unique definitions of key performance indicators, the management will not have the clarity they need to take strategic decisions.
Although the implementation of business intelligence tools changes the situation by merging the untied data streams into a unified real-time reporting system, organizations that have invested in good data infrastructure will have shorter decision-making periods, fewer manual engineering works, and better operational efficiency that is hidden behind the server logs.
When an organization adopts new technologies, difficulties arise. High license costs, long employee adaptation to a new program, obsolete database migration problems, and the learning curve for non-technical employees make it difficult to follow the usual working processes. In many companies, there is a challenge to provide maximum access to huge numbers of people and the requirements of security measures that might slow down the implementation process.
Nonetheless, the benefits in the long-run strongly outweigh these temporary obstacles. The introduction of an updated unified data system has converted passive statistics into an active business strategy. Organizations that have overcome obstacles during implementation process have achieved permanent organizational agility transforming the raw numbers about operations into a competitive advantage.
Check the Status of The Existing Data System: mapping all cloud services, data pipelines, and protecting measures beforehand will help during evaluation of prospective vendors.
Specify the Duties of Primary Users: analyze whether the team requires developer-oriented modeling data analytics platforms (like Looker) or user-friendly querying interfaces (like ThoughtSpot)
Test Governance Capabilities: Ensure candidate systems offer granular permission controls and unified metric definitions across departments.
Verify Scalability and Cost Models: Analyze how licensing costs scale as user concurrency and query volumes grow over time.
Monitor the Industry Benchmarks: keep abreast of the data analytics software assessments by analyzing different reports published by the market leaders.
Everything you need to know about this news
Business intelligence concentrates on analyzing both past and present data to make business decisions on a daily basis. Data analytics has a broader field of activity including forecasting modeling, statistical analysis, and machine learning algorithms designed for predicting different events.
Modern platforms like Looker and Tableau query cloud warehouses directly without storing copy datasets locally. Thus, latency is reduced, and data security is improved for users in their constant analysis of current operational records.
Yes, modern self-service platforms operate on strict semantic layers. Through self-service analytics solutions, non-technical users can easily create reports and ask ordinary questions, but they cannot change the underlying database structure.
Managing boards of enterprises should review their technology solutions every 2 to 3 years.
Executive leadership teams can access platform comparisons, tech trends, and software evaluation guides directly through editorial reviews on CIO Bulletin.




















 consultants ltd.jpg)


Comments