Home Technology Data analytics Executives want real-time dash...
Data Analytics
CIO Bulletin,
16 March, 2026
Author:
CIO Bulletin Team
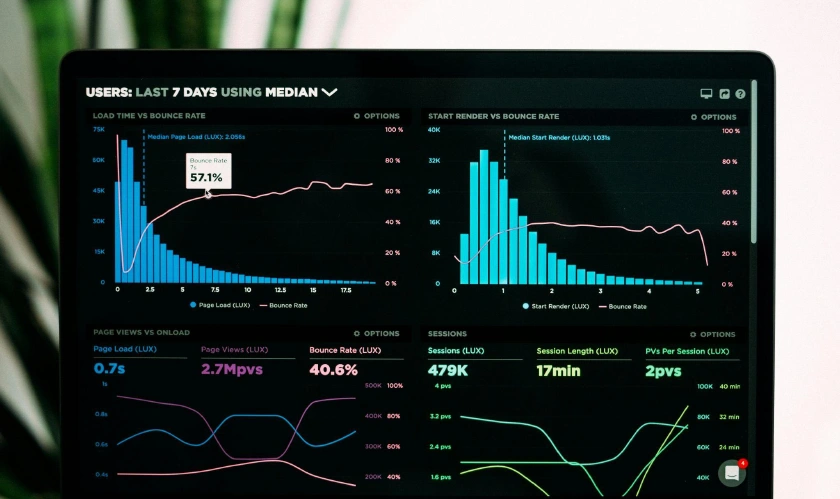
Executives are asking for dashboards that deliver instant insights and support quick, high-stakes decisions.
But inside many companies, the push for real-time data runs into a persistent challenge: teams can't agree on what the metrics actually mean.
This isn't just a technical hurdle. Disagreements over definitions can affect revenue, operations, and even leadership confidence.
As the pressure for speed increases, these internal debates shape how companies respond to new information, sometimes slowing critical action.
The tension between executive urgency and data team caution is redefining what business intelligence needs to deliver at the highest level.
Understanding—and resolving—these underlying conflicts has become essential for organizations that want dashboards to truly drive better decisions.
When executives demand faster answers, long-standing issues with data definitions quickly come to the surface.
Real-time dashboards promise instant insight, but they also reveal just how much organizations struggle to agree on what their numbers actually mean.
Leaders increasingly expect dashboards to update in real time, highlight trade-offs, and provide numbers that match from one team to the next.
But data teams often find themselves revisiting the same debates about metric definitions—sometimes under intense pressure when leadership needs answers right away.
For example, one executive might see a sudden dip in a dashboard and want immediate clarity, while analysts scramble to figure out whose version of revenue or conversion rate is correct.
This cycle repeats as teams realize that even small differences in definitions can lead to big misunderstandings at the top.
Discrepancies cause confusion, delay decisions, and can even undermine trust in the dashboards themselves.
The need for shared understanding is especially clear in high-stakes environments where a single conflicting metric can stall action or spark a costly misstep.
To see how clarity and comparability shape decisions in complex organizations, click here.
This need for shared clarity becomes even more visible when dashboards do their job well and executives actually trust what they see.
Trust is fragile in these environments. When numbers change without explanation, or when the same metric looks different from one report to another, confidence erodes fast.
Executives want dashboards that are predictable and transparent about why numbers shift. They look for clear signals that tie directly to business outcomes, not just raw data feeds.
One manufacturing division recently connected its dashboard directly to the ERP system. Within the first month, leaders caught a spike in overtime costs and noticed a looming inventory shortage—together, these insights helped the team avoid $50,000 in losses and unnecessary overtime shifts.
Executives responded with decisive action, using the dashboard as a daily tool for operational decisions. This kind of trust grows when users understand exactly what each number means and why it matters to the business.
Dashboards that succeed share a few features:
They explain why figures have changed, not just what the new numbers are.
They stay consistent across teams and reports, avoiding conflicting metrics.
They focus on results that matter to enterprise goals and strategy.
They make trade-offs and risks visible, not hidden in fine print.
They are reliable every time, building a record of accuracy over weeks and months.
Alignment around definitions before launch is key. When everyone agrees on what each metric means, urgent decisions can be made without hesitation or back-and-forth.
For organizations looking to build this level of transparency and alignment, the Executive Dashboards Framework explores proven strategies for making dashboards clear, comparable, and actionable at the highest level.
Even with strong frameworks in place, disagreements about what dashboard metrics really mean keep surfacing.
For data teams, these arguments aren’t just about numbers—they’re about defending the accuracy and integrity of business decisions.
Agreeing to a fuzzy or inconsistent definition can feel like putting their credibility on the line.
So when executives need rapid answers, some teams become even more insistent on validating every detail, even if it means missing tight deadlines.
This tension grows when dashboards are expected to deliver instant clarity, but the underlying data is still under debate.
The result is a familiar standoff: leaders want speed and simplicity; data professionals want precision and reliability.
Executives may scan a dashboard, see numbers that don’t match across reports, and quickly lose confidence—especially when explanations aren’t fast or clear.
Verified research shows these conflicting metrics and slow responses are top reasons trust in dashboards breaks down.
Addressing these core issues is essential for dashboards to actually help drive decisions, not just create more confusion.
For more on the roots of executive skepticism, see Why Executives Don’t Trust Dashboards.
This ongoing tension has pushed some organizations to try new ways of aligning teams on what metrics mean—before dashboards even launch.
Instead of letting debates drag on, these groups set up cross-functional workshops where business leads and data specialists hash out definitions together. Involving senior leadership early can break deadlocks that would otherwise stall progress for weeks.
Teams that make real progress don’t just agree once and move on. They revisit key terms as business goals shift, making sure everyone is still talking about the same thing. This kind of process helps dashboards stay relevant and trusted, rather than becoming another source of friction.
There’s a practical side to this, too. Companies that get alignment right see dashboards actually shape decisions—because executives know what the numbers are telling them. For example, when outcome-oriented metrics are agreed upon, leaders can react quickly to trends, confident that the data is reliable and consistent across departments.
To keep this alignment manageable at scale, some have turned to new tools that let teams share, compare, and update their definitions in real time. Innovations in workflow management automation help teams document and validate metric changes as part of their daily routine.
As organizations experiment with these approaches, the result is often less confusion and more trust in dashboards—making it easier for executives to make rapid, well-informed decisions when it matters most.
When dashboards become clearer and more reliable, the next challenge is often rebuilding trust between executives and data teams.
Technical fixes alone rarely close the gap. Leaders and analysts need space for honest discussion about context, goals, and what dashboards are meant to signal.
Regular forums or brief check-ins give both sides a chance to clarify shifting priorities, explain unexpected results, and ensure everyone understands the trade-offs behind the numbers.
Organizations that build these conversations into their dashboard process see faster, more confident decisions—regardless of how metrics might evolve over time.
Tools like behavioral analytics dashboards can support this dynamic by making it easier to surface insights and share feedback in real time.


 consultants ltd.jpg)


