Home Technology Data analytics Data Analysis of Brussels Cycl...
Data Analytics
CIO Bulletin,
23 May, 2026
Author:
Sambhrant Das
Data Scientists Merge Crowd Sourced Fitness Metrics and Government Sensors to Pinpoint Thirty High Risk Municipal Traffic Roadblocks Missing Dedicated Barriers
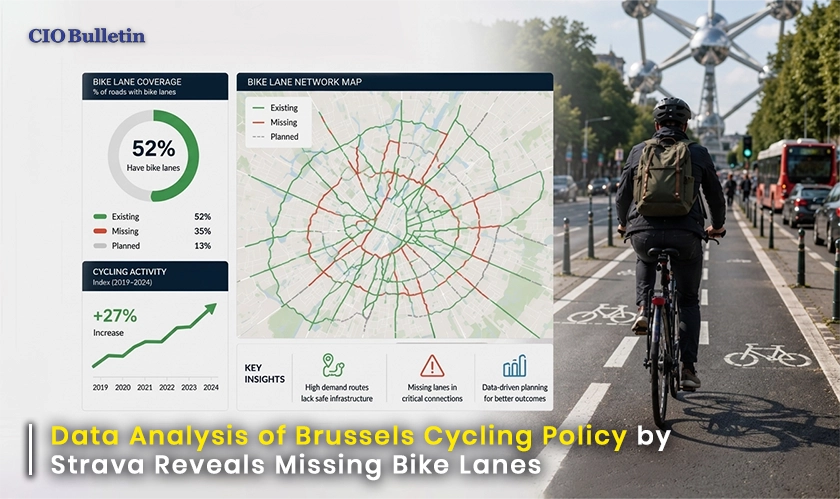
Urban infrastructure planners are finding that relying solely on manual street counts can warp municipal budgets and leave dangerous traffic areas completely unaddressed. Traditionally, city boards track bicycle volume using a handful of fixed sensors, but these units are almost exclusively located on pre-existing, well-paved tracks. This survival bias leaves administrators blind to the actual pathways commuters take when forced onto unprotected roads. To resolve this information gap, researchers at Vrije Universiteit Brussel (VUB) paired government metrics with crowd sourced fitness data, revealing structural oversights within the current Brussels cycling policy that leave thousands of active riders exposed to heavy vehicle traffic.
By training a specialized machine learning algorithm on anonymous tracking files from the athletic application Strava, the academic team mapped out where regional bike travel is heaviest. Layering these digital footprints over the capital's geographic map exposed thirty critical bottlenecks where the volume of daily riders matches the busiest highways, despite lacking any dedicated concrete barriers. The study categorized these urgent structural failures into two distinct municipal trouble zones:
Interrupted Commuter Links: Sections along the central canal where smooth, segregated bike lanes suddenly vanish, forcing regular travelers onto standard roads without warning.
Spontaneous Traffic Arteries: Busy commercial strips like Troonlaan or Dansaertstraat that process massive, daily bike crowds on narrow asphalt segments shared directly with commercial trucks.
The core issue with standard municipal tracking is that the region's eighteen physical sensors only record riders who are already using premium pathways. This creates a misleading feedback loop where funds keep going to already-safe corridors while high-risk gaps remain ignored. Explaining the data limitations that previously stalled structural upgrades, VUB researcher Sara Tori stated, “This creates a blind spot: people know how many people cycle on existing cycle lanes, but have no insight into traffic flows on roads where no safe infrastructure is yet in place.”
Leveraging crowd sourced application data lets transportation boards shift from reactive patch-ups to predictive, high-yield infrastructure investments. Even though application users skew toward confident, long-distance daily commuters, their collective travel patterns highlight exactly where the public organically flows. Using these real-world data tracks allows engineering offices to deploy protective bollards and widen high-congestion corridors based on where active traffic is already dense, maximizing safety returns on every dollar spent.
Transitioning to algorithmic mapping helps regional administrations avoid political posturing when deciding which streets to overhaul. Having hard, empirical proof of commuter density gives planning boards the objective leverage needed to push past local parking disputes and business complaints. CIO Bulletin views this development as a foundational milestone for smart-city governance, demonstrating that merging crowd sourced user data with public archives is the absolute fastest way for modern cities to eliminate bureaucratic blind spots and protect civilian lives on shared roads.


 consultants ltd.jpg)


