
Home Industry Compliance and governance Thanksgiving Month Reality: Ab...
CIO Bulletin, 17 November, 2026
Author:
Rick Adams
KEY HIGHLIGHTS
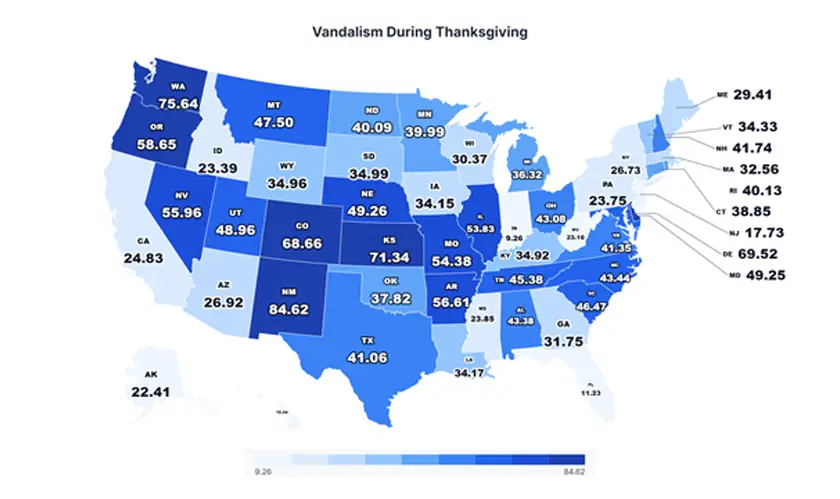
New Mexico recorded the highest November vandalism rate at 84.6 incidents per 100,000 residents, 2.3 times the national average of 36.1, followed by Washington (75.6) and Kansas (71.3).
Indiana recorded the lowest November vandalism rate of the 50 states, at 9.3 incidents per 100,000 residents, with an average of 637 recorded incidents each November.
S. law enforcement agencies recorded 606,185 vandalism incidents across the five Novembers from 2021 to 2025, an average of 121,237 each November, or about 4,041 every day.
As Thanksgiving approaches, families pack up the car, airports fill up, and homes sit quiet while vehicles wait in long-term lots and on busy streets. New analysis of Federal Bureau of Investigation (FBI) data shows where recorded vandalism was highest during the month of Thanksgiving, both per resident and by total volume.
For this analysis, Ladah Injury & Car Accident Lawyers Las Vegas took recorded November vandalism incidents (Destruction/Damage/Vandalism of Property) from the FBI Crime Data Explorer for all 50 states from 2021 to 2025. Each state's five-year November average was divided by its average population over the same period to produce a rate per 100,000 residents, which was used to rank the states.
|
State |
Average Population (2021 to 2025) |
Average November Incidents |
Incidents per 100,000 Residents |
Rank |
|
New Mexico |
2,119,869 |
1,794 |
84.6 |
1 |
|
Washington |
7,859,312 |
5,945 |
75.6 |
2 |
|
Kansas |
2,952,021 |
2,106 |
71.3 |
3 |
|
Delaware |
1,033,108 |
718 |
69.5 |
4 |
|
Colorado |
5,899,932 |
4,051 |
68.7 |
5 |
|
Oregon |
4,253,121 |
2,495 |
58.7 |
6 |
|
Arkansas |
3,068,481 |
1,737 |
56.6 |
7 |
|
Nevada |
3,213,119 |
1,798 |
56.0 |
8 |
|
Missouri |
6,211,661 |
3,378 |
54.4 |
9 |
|
Illinois |
12,646,498 |
6,807 |
53.8 |
10 |
New Mexico recorded 84.6 incidents per 100,000 residents, 2.3 times the national average of 36.1. Washington (75.6) recorded more than double the national rate, and Kansas (71.3) recorded nearly double. Five of the 10 states are in the West, and together the top 10 account for 25.4% of all recorded November vandalism while holding 14.7% of the U.S. population. Nevada ranks 8th at 56.0, 55% above the national average, and Illinois is the only top-10 state where recorded November vandalism rose from 2021 to 2025 (up 15.9%).
Looking at the study, Ramzy Ladah, Founder & CEO of Ladah Injury & Car Accident Lawyers Las Vegas, commented:
“Thanksgiving brings families together, yet in an average November, about 4,041” or “about 4,000 were recorded each day. Many homes sit empty, and vehicles stay parked for days at airports or on busy streets during the holiday month. If you find damage, photograph it right away, file a police report promptly, and park in well-lit or monitored areas when you can.”
|
State |
November 2021 Incidents |
November 2025 Incidents |
Decline |
Rank |
|
Oregon |
3,462 |
1,675 |
51.6% |
1 |
|
Washington |
7,754 |
3,883 |
49.9% |
2 |
|
Alaska |
186 |
100 |
46.2% |
3 |
|
Vermont |
263 |
154 |
41.4% |
4 |
|
Connecticut |
1,643 |
989 |
39.8% |
5 |
|
Indiana |
673 |
421 |
37.4% |
6 |
|
Oklahoma |
2,012 |
1,266 |
37.1% |
7 |
|
Maine |
524 |
335 |
36.1% |
8 |
|
Tennessee |
3,642 |
2,341 |
35.7% |
9 |
|
Arkansas |
2,118 |
1,364 |
35.6% |
10 |
Oregon recorded the steepest drop in November vandalism, down 51.6% from 3,462 incidents in 2021 to 1,675 in 2025, followed by Washington, down 49.9% (from 7,754 to 3,883). Despite cutting their November totals roughly in half, Washington and Oregon still rank 2nd and 6th nationally for rate. Alaska (down 46.2%) and Vermont (down 41.4%) follow. Nationally, November vandalism reached a five-year high of 132,903 recorded incidents in 2023, then fell 17.8% to 109,258 in 2025, the lowest of the five years.
|
State |
Incidents per 100,000 Residents |
Rate Rank (of 50) |
Average November Incidents |
Rank |
|
Texas |
41.1 |
22 |
12,568 |
1 |
|
California |
24.8 |
41 |
9,735 |
2 |
|
Illinois |
53.8 |
10 |
6,807 |
3 |
|
Washington |
75.6 |
2 |
5,945 |
4 |
|
New York |
26.7 |
40 |
5,289 |
5 |
|
Ohio |
43.1 |
19 |
5,093 |
6 |
|
North Carolina |
43.4 |
17 |
4,720 |
7 |
|
Colorado |
68.7 |
5 |
4,051 |
8 |
|
Michigan |
36.3 |
28 |
3,660 |
9 |
|
Virginia |
41.3 |
21 |
3,617 |
10 |
Texas recorded the most November vandalism of any state, an average of 12,568 incidents, about 419 per day, and 62,840 across the five years, yet it ranks 22nd for rate at 41.1 per 100,000 residents. California (9,735) and Illinois (6,807) follow. Illinois, Washington, and Colorado are the only states in the top 10 for both volume and rate. By region, the South recorded the most November vandalism, an average of 46,238 incidents, or 38.1% of the national total.
|
State |
Average Population (2021 to 2025) |
Average November Incidents |
Incidents per 100,000 Residents |
Rank |
|
Indiana |
6,879,766 |
637 |
9.3 |
1 |
|
Florida |
22,694,282 |
2,548 |
11.2 |
2 |
|
Hawaii |
1,439,171 |
221 |
15.3 |
3 |
|
New Jersey |
9,373,747 |
1,662 |
17.7 |
4 |
|
Alaska |
735,413 |
165 |
22.4 |
5 |
|
West Virginia |
1,772,862 |
411 |
23.2 |
6 |
|
Idaho |
1,967,207 |
460 |
23.4 |
7 |
|
Pennsylvania |
13,007,186 |
3,089 |
23.7 |
8 |
|
Mississippi |
2,945,383 |
702 |
23.8 |
9 |
|
California |
39,203,789 |
9,735 |
24.8 |
10 |
Indiana recorded the lowest November vandalism rate of the 50 states, at 9.3 incidents per 100,000 residents, and New Mexico's rate is 9.1 times Indiana's. Florida (11.2) and Hawaii (15.3) follow. California also appears in this table, ranking 2nd for volume with an average of 9,735 November incidents but 41st for rate, at 24.8. Low recorded rates can partly reflect differences in agency reporting. Four of the 10 are in the West: Alaska, Hawaii, Idaho, and California.
This study uses Destruction/Damage/Vandalism of Property incidents recorded in the FBI Crime Data Explorer, part of the Uniform Crime Reporting (UCR) Program, for every November from 2021 to 2025. Each state's five-year November average was divided by its average 2021–2025 state population estimate and multiplied by 100,000, and states were ranked by this rate at full precision, so states that appear tied keep the order shown. Per-day figures are based on a 30-day month, and regions follow U.S. Census Bureau definitions. Figures reflect incidents recorded by participating law enforcement agencies, and recent figures may be revised. Agency reporting changed in California, New York, Florida, and New Jersey, so their 2021 to 2025 trends are not cited. Washington, D.C., is excluded, and national figures are the 50-state total.
FBI Crime Data Explorer, Uniform Crime Reporting Program: https://cde.ucr.cjis.gov/LATEST/webapp/#/pages/explorer/crime/crime-trend
Research Dataset: https://docs.google.com/spreadsheets/d/1Xwr3EKPbOmL755cDjRV0dcAnY6uEArat0mbs-_4rjIM/edit?gid=0#gid=0
Study by → https://www.ladahlaw.com/
About Ladah Injury & Car Accident Lawyers Las Vegas
Ladah Injury & Car Accident Lawyers Las Vegas is a personal injury and car accident law firm based in Las Vegas, Nevada, representing clients in car accident, personal injury, and related cases.





















































 consultants ltd.jpg)


Comments